See your CSVs
Following on the tails of 3D models and geographic data, GitHub.com now also supports rendering tabular data in the form of .csv (comma-separated) and .tsv (tab-separated) files. When viewed, any…
Following on the tails of 3D models and geographic data, GitHub.com now also supports rendering tabular data in the form of .csv (comma-separated) and .tsv (tab-separated) files.
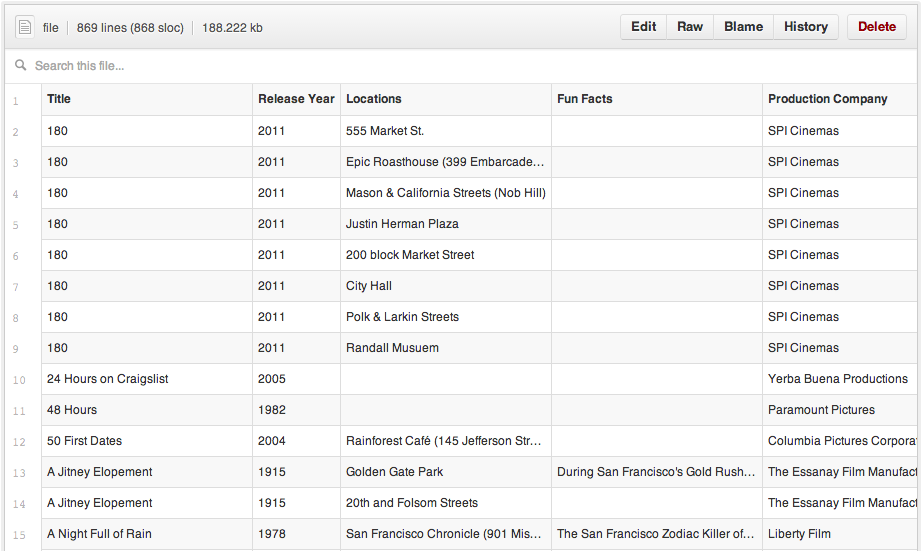
When viewed, any .csv or .tsv file committed to a GitHub repository will automatically render as an interactive table, complete with headers and row numbering.
You can even link to a particular row simply by clicking the row number, or select multiple rows by holding down the shift key. Just copy the URL and send it to a friend.
Want to see if a certain value is in your dataset? Just start typing and the data filters itself.
Building software is about more than code. Whether analyzing a government dataset, comparing performance benchmarks, or parsing crash reports, working with tabular data on GitHub just got a little bit easier.
For more information, check out our help article.
Happy Analyzing!
Written by

Related posts

Introducing Agent HQ: Any agent, any way you work
At Universe 2025, GitHub’s next evolution introduces a single, unified workflow for developers to be able to orchestrate any agent, any time, anywhere.

Octoverse: A new developer joins GitHub every second as AI leads TypeScript to #1
In this year’s Octoverse, we uncover how AI, agents, and typed languages are driving the biggest shifts in software development in more than a decade.

Announcing the 2025 GitHub Partner Award winners 🎉
GitHub celebrates its 2025 Partner Award winners, honoring global, regional, and technology partners for driving innovation, collaboration, and impact across the developer ecosystem.