Bad rounding when earth_relief_03s is used due to filler 15s grid #4129
Description
Description of the problem
This command fails because the intensity grid gets messed up (#4124):
gmt grdimage @earth_relief_03s -Cgeo -R3:58:12/4:16:12/44/44:15 -I -JM6i -B -pdf map
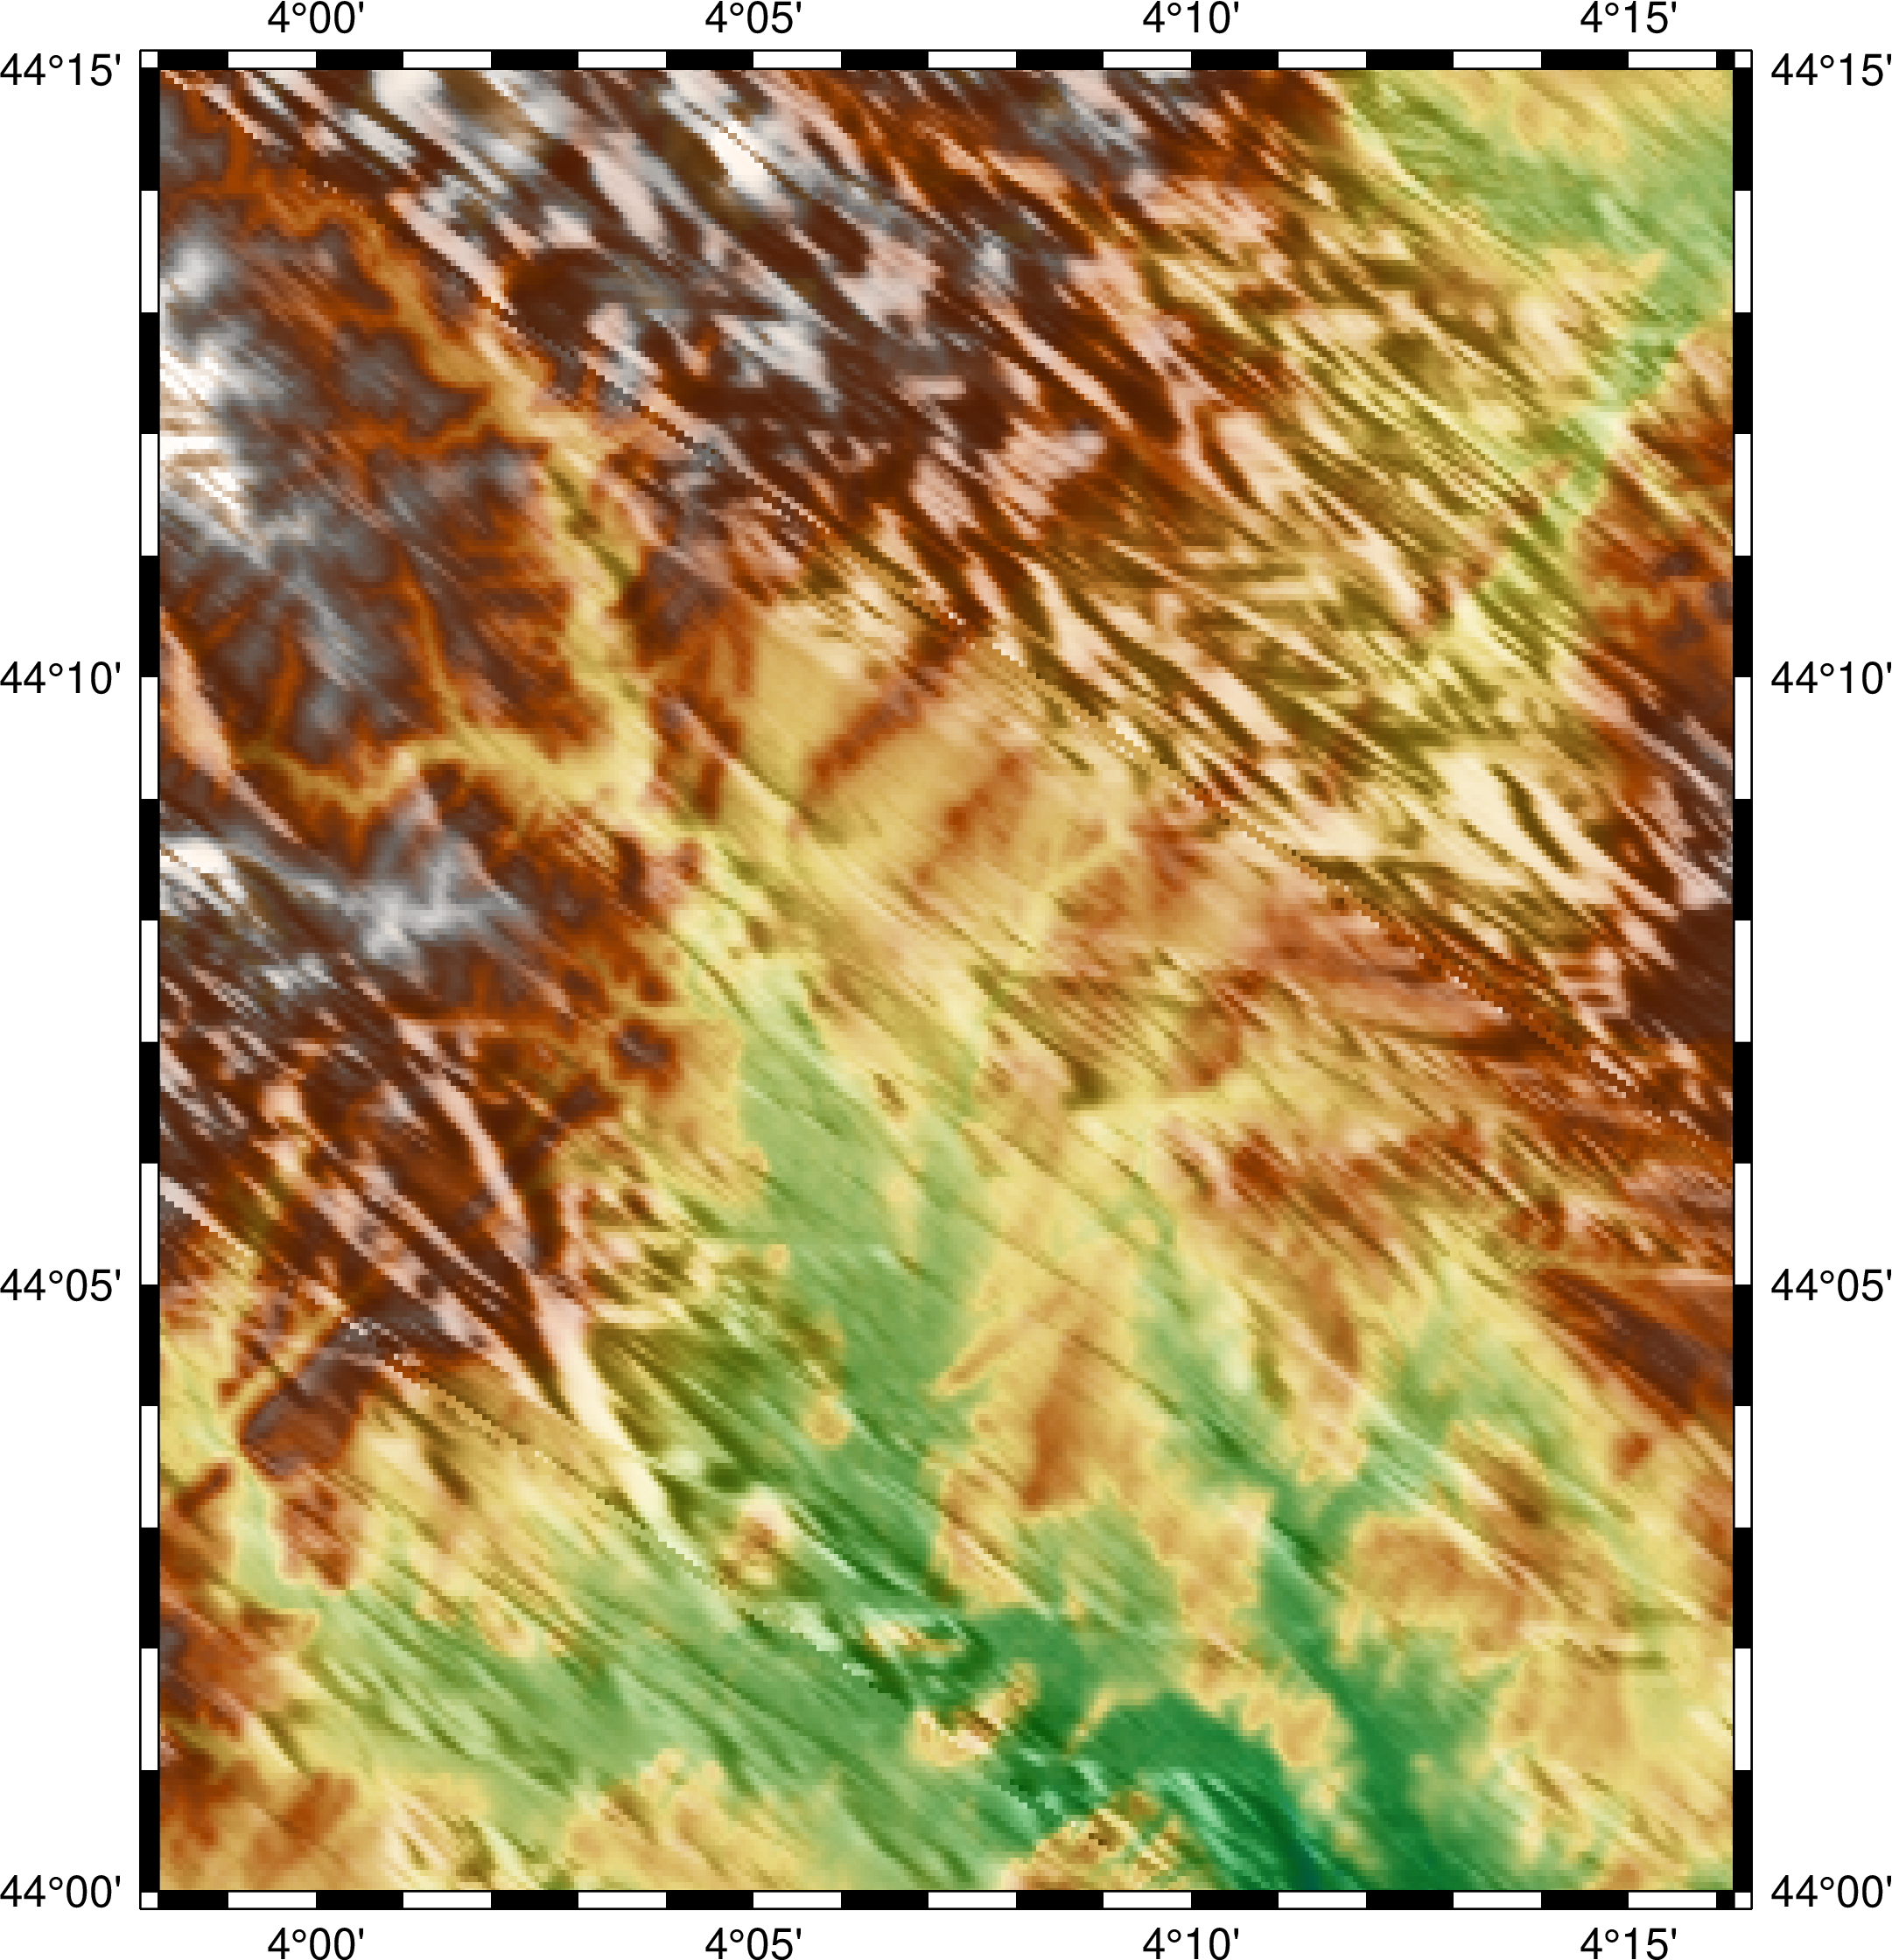
When a plot using earth_relief_03s is specified, we also add in the 15s tiles in case there is ocean. In this case we determine that the tile region is 3/5/44/45 and that there are 2 tiles and they both exist. However, from this information alone we do not know if one of both of the tiles deal with coastlines or islands and that there may be ocean areas within the tiles that will have no data. The initial implementation in 6.0 worked a bit harder at this by creating a perimeter lon,lat dataset in steps of the grid and pass these coordinates to gmtselect -N to see if they were on land or not. If all points were on land then we declined to add earth_relief_15s, otherwise we have a mixed case and we added in the ocean tile. However, in 6.1 we dropped that and always add int the corresponding ocean tile just in case since it really does not add much work [in 6.0 we had to download the entire 2.6 Gb 15s data so it was important to do so only if absolutely necessary]. In 6.1 we may have non-relief files with similar coverage and calling gmtselect -N may not make sense.
Because we now have two 3s tiles (gridline registration) and one 15s tile (pixel registration), grdblend works to resample the 15s at the 3s nodes to return the final grid. In the end it finds none of those points will be used. Despite sounding like lots of work, it goes very quickly. It is generally correct:
- If no auto-intensity is requested then the plot is perfect
- If the region is adjusted to multiples of 15s (
-R3:58:15/4:16:15/44/44:15) then it also works with -I.
With the original coordinates, we determine the correct region in multiple of 15s, which is indeed -R3:58:15/4:16:15/44/44:15, and that region is used when requesting the data. The resulting grid has those bounds and is 366x301 nodes. This looks just fine. Then, because of auto-I we pass this grid via memory to grdgradient. Back comes another co-registered grid so the plot completes, but it is wrong due to bad shading.
A few observations:
- If I use grdcut on the original region and save the cut, run grdgradient on it and make the plot then of course it is fine.
- If I run grdgradient directly on @earth_relief_03s and save that and use it with the saved subset it works fine.
- If I used that last intensity grid with @earth_relief_03s and original -R directly then we get data and intensity grids of different dimensions. Not clear why that should happen so will need to debug that case.
Best bet is that when input region is not a multiple of 15s then there seems to be a rounding somewhere that wraps the data around (to mess up the intensity positions) yet maintains the correct dimension (so the plot can be made).