Wifi-visualizer is a Matlab application created in the app designer. It can visualize electromagnetic waves of WiFi in any building, given its plan and router position. Thus, one can find the most optimal router position that will cover with signal the whole property or increase WiFi strength in particular rooms.
The application reads the plan of a building as a matrix where 1px in the image is 1cm in reality. Then, it calculates the spread of electromagnetic waves, which are modeled by the Helmholtz equation. It is the partial differential equation (PDE) that can be solved numerically (it may take time for huge matrices). Finally, after beautifying and "smoothing" the solution, waves are plotted in the application.
- Open app directory in Matlab (app tested on version R2018a).
- Type
wifiappin console. - Set router position by clicking on displayed building plan.
- Press "Draw WiFi" button to see your WiFi signal!
Besides that, you can tweak settings like
- router frequency,
- color of waves
and do
- change building plans,
- save generated images.
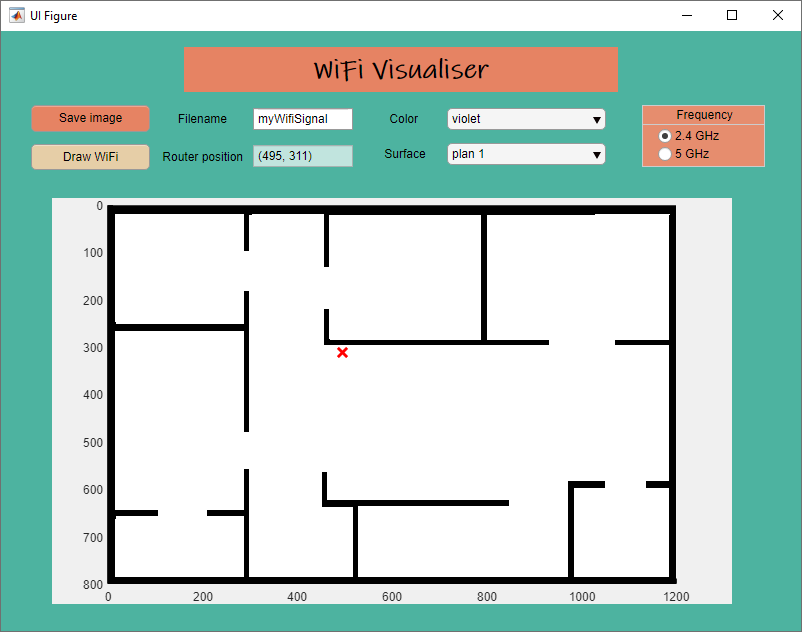 Main view of the app (before drawing WiFi signal). Red cross marks the router position.
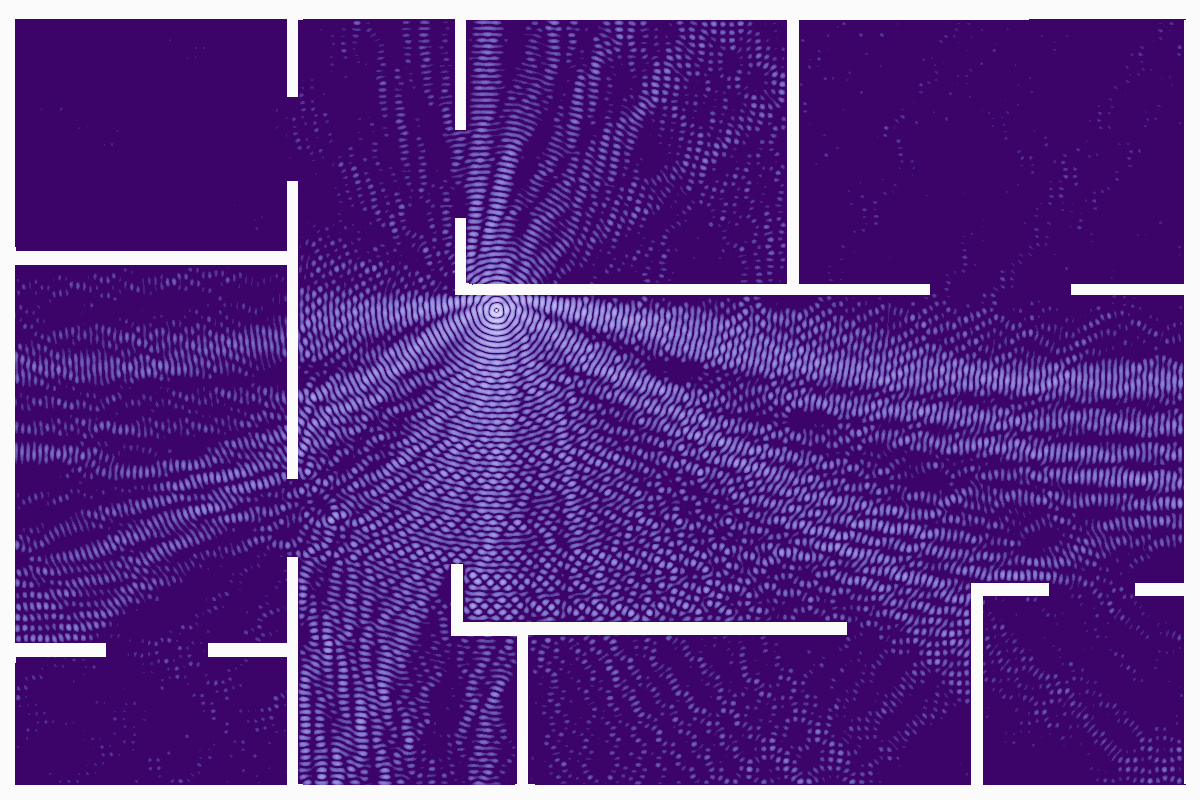 Example of good router positioning. Waves are strong in larger part of the property.
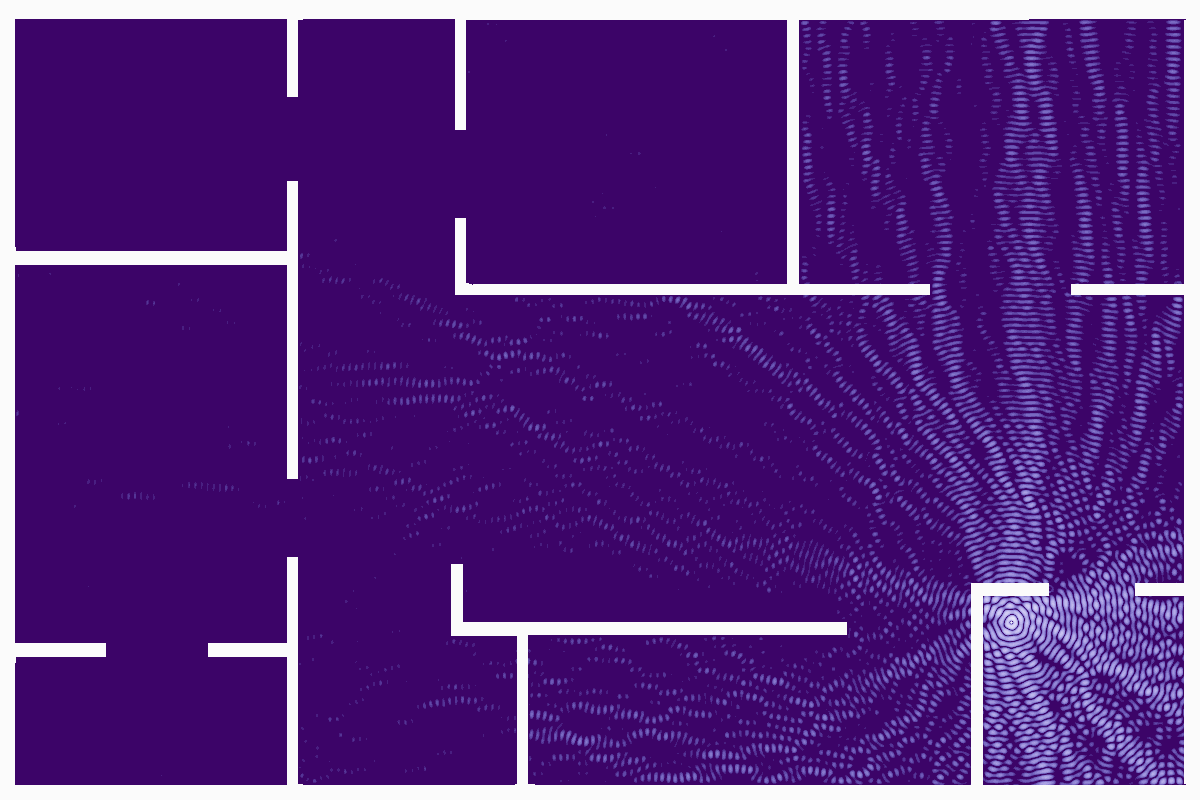 Example of bad router positioning. The WiFi signal is trapped in one room and can barely escape.
The application was designed by Michal Szachniewicz (szacho) and Anna Klimiuk (Stardust87) as university project.
Wifi-visualizer is released under MIT License.