Written by Eduardo Hirata-Miyasaki, Ziwen Liu, and Shalin Mehta, CZ Biohub San Francisco with many inputs from Diane Adjavon and Albert Dominguez Mantes for the AI@MBL2025 course 🐙
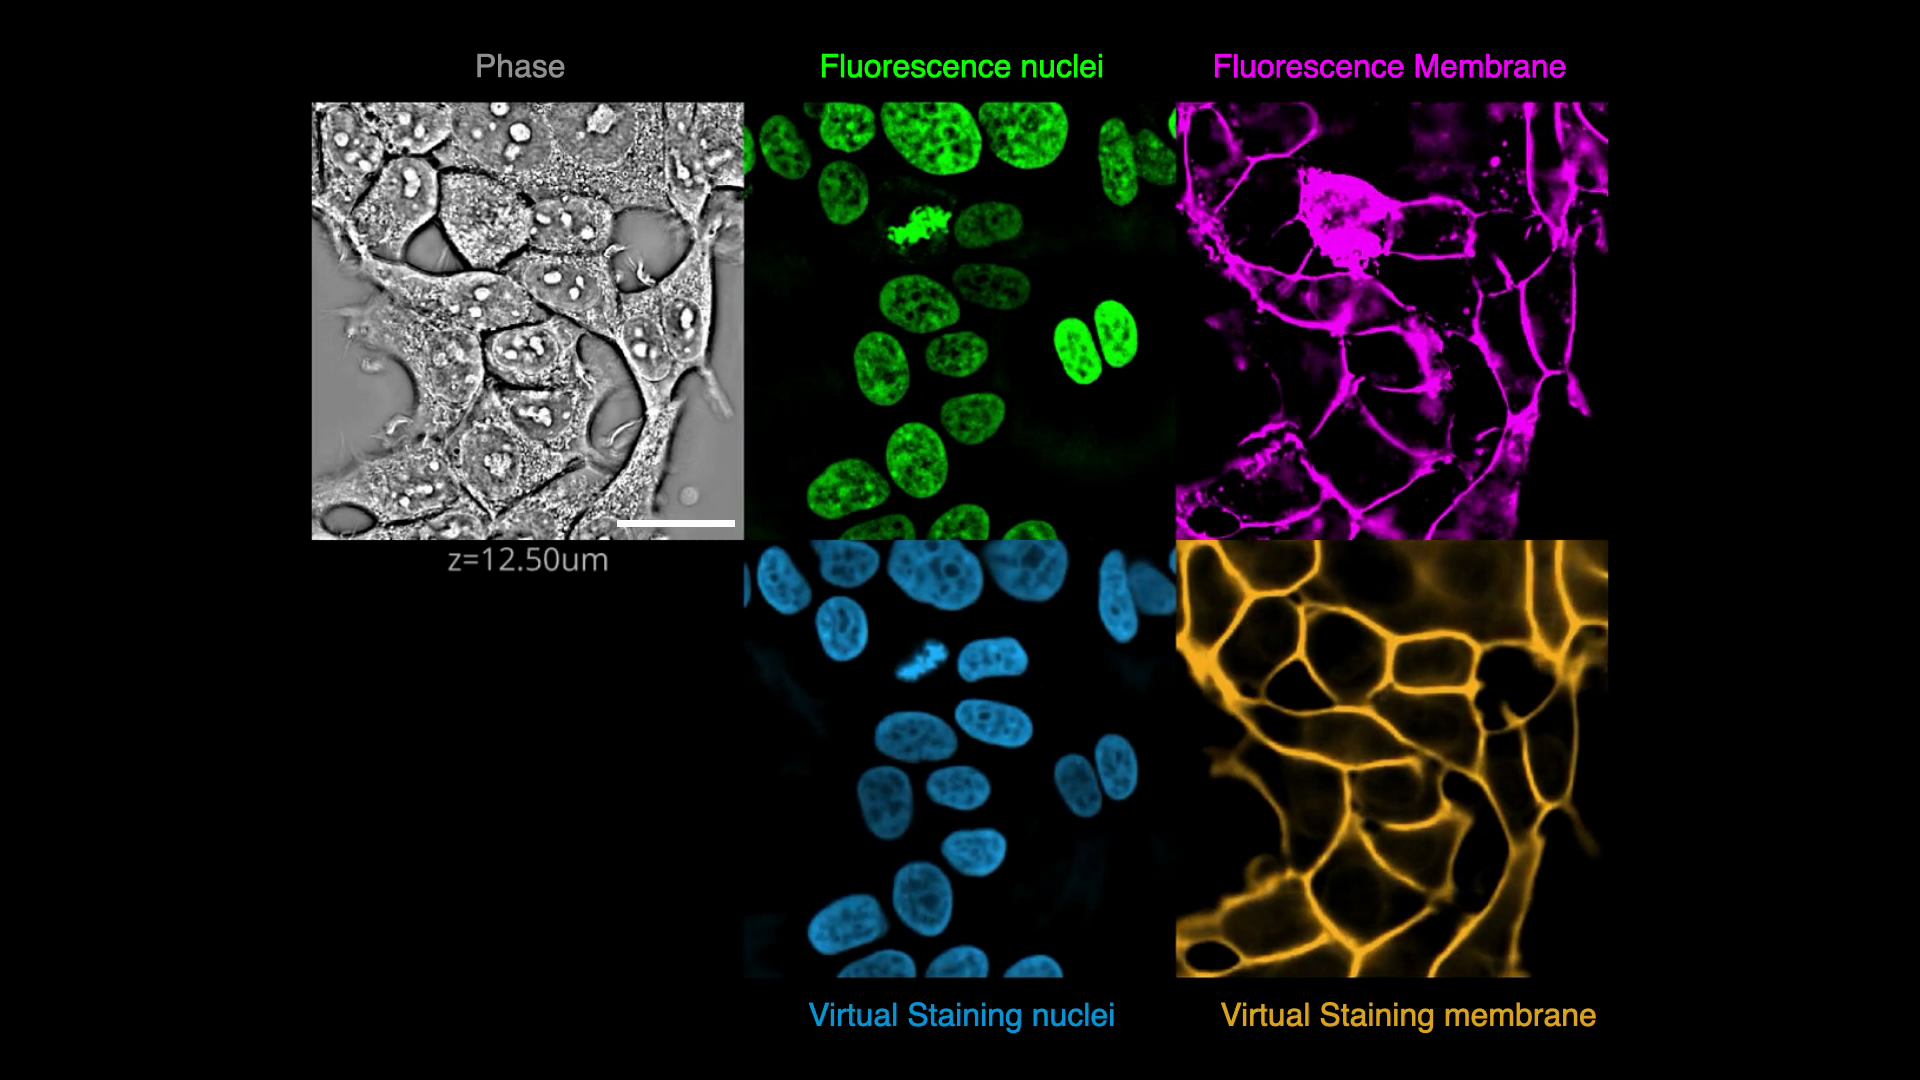
In this exercise, we will virtually stain the nuclei and plasma membrane from the quantitative phase image (QPI), i.e., translate QPI images into fluoresence images of nuclei and plasma membranes. QPI encodes multiple cellular structures and virtual staining decomposes these structures. After the model is trained, one only needs to acquire label-free QPI data. This strategy solves the problem as "multi-spectral imaging", but is more compatible with live cell imaging and high-throughput screening. Virtual staining is often a step towards multiple downstream analyses: segmentation, tracking, and cell state phenotyping.
In this exercise, you will:
- Train a model to predict the fluorescence images of nuclei and plasma membranes from QPI images using CytoLand
- Make it robust to variations in imaging conditions using data augmentions
- Segment the cells
- Use regression and segmentation metrics to evalute the models
- Visualize the image transform learned by the model
- Understand the failure modes of the trained model
 (Click on image to play video)
- Explore OME-Zarr using iohub and the high-content-screen (HCS) format.
- Use our
viscy.data.HCSDataloader()dataloader and explore the 3 channel (phase, fluoresecence nuclei and cell membrane) A549 cell dataset. - Implement data augmentations MONAI to train a robust model to imaging parameters and conditions.
- Use tensorboard to log the augmentations, training and validation losses and batches
- Start the training of the UNeXt2 model to predict nuclei and membrane from phase images.
- Compare the performance of your trained model with the VSCyto2D pre-trained model.
- Evaluate the model using pixel-level and instance-level metrics.
- Compare the model trained from fluorescence to phase
Part 3: Visualize the image transforms learned by the model and explore the model's regime of validity
- Visualize the first 3 principal componets mapped to a color space in each encoder and decoder block.
- Explore the model's regime of validity by applying blurring and scaling transforms to the input phase image.
Checkout VisCy, our deep learning pipeline for training and deploying computer vision models for image-based phenotyping including the robust virtual staining of landmark organelles.
VisCy exploits recent advances in data and metadata formats (OME-zarr) and DL frameworks, PyTorch Lightning and MONAI.
Create an mkdir image_translation folder and cd image_translation command into it.
Run the setup script to create the environment for this exercise and download the dataset.
sh setup_student.sh
Activate your environment
conda activate 04_image_translationInstall vscode, install jupyter extension inside vscode, and setup cell mode. Open exercise.py and run the script interactively.
The matching exercise and solution notebooks can be found here on the course repository.
Launch a jupyter lab environment
jupyter lab
...and continue with the instructions in the notebook.
If 04_image_translation is not available as a kernel in jupyter, run:
python -m ipykernel install --user --name=04_image_translation