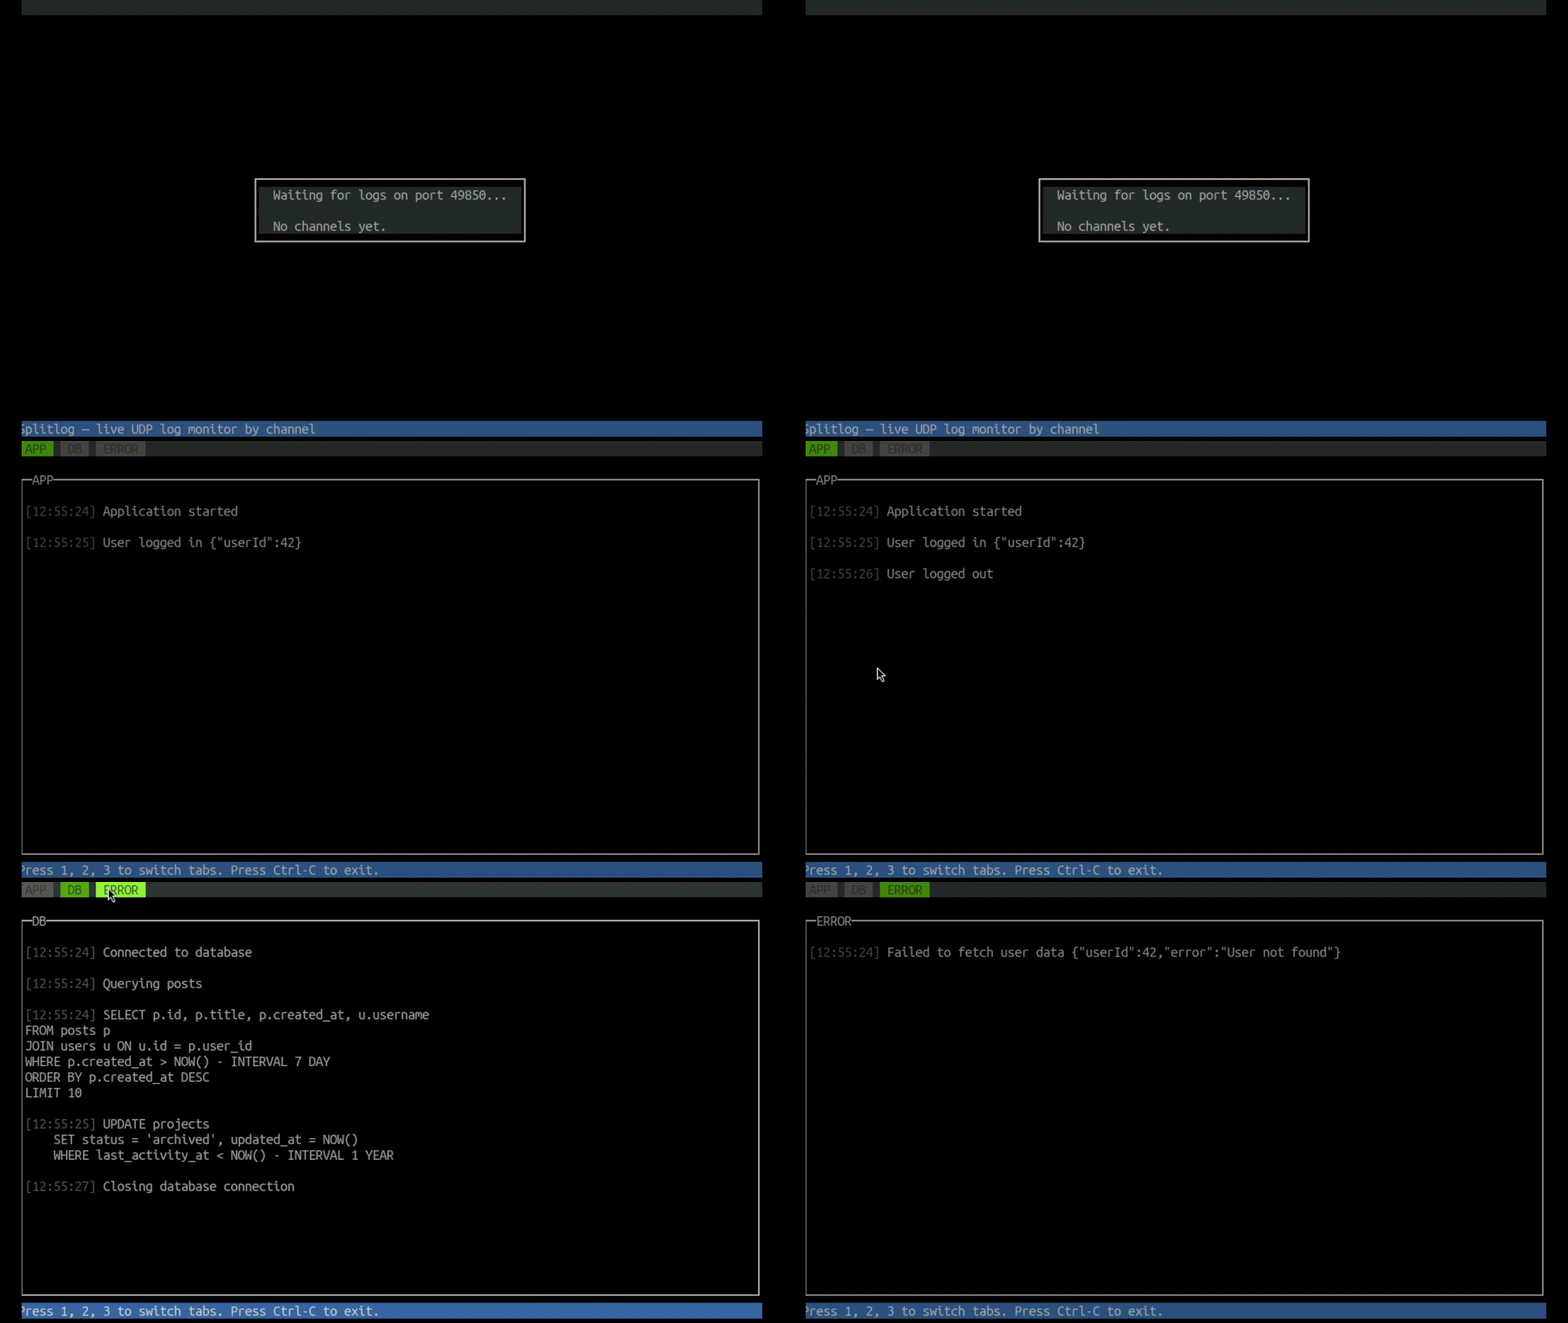
A developer tool that supercharges
debugby routing logs over UDP and visualizing them in a multi-pane CLI interface.
splitlog helps separate and monitor logs from multiple services or modules with ease by using logical channels, dynamic port mapping, and structured JSON output.
-
Tiny Logging Library
Pipe logs over UDP with ease, from anydebuglogger. -
CLI Log Monitor
Real-time multi-tab terminal UI usingblessed, showing logs per channel. -
Channel Registry
Auto-discovers ports via a naming registry (/tmp/splitlog_channel), so clients don’t need to know port info up front. -
JSON Mode
Supports structured logging for better parsing and formatting.
- 🧩 Multi-service debugging
- 🔀 Frontend/backend log separation
- 🧹 Cleaner, isolated dev environments
- 🧪 Live observation of microservices or workers
npm install -g @dsheiko/splitlogStart a UDP listener and terminal UI for logs:
splitlog-p, --port <number> UDP port to listen on (defaults to first available port)The CLI will automatically:
- Start a UDP listener
- Register the port in
/tmp/splitlog_channel - Show logs grouped by channels in separate panes
import debug from "debug";
import splitlog from "@dsheiko/splitlog";

const logApp = splitlog( debug( "APP" ) );
const logDb = splitlog( debug( "DB" ) );
const logError = splitlog( debug( "ERROR" ) );

logApp( "Application started" );
logDb( "Connected to database" );
logError( "Failed to fetch user data", { userId: 42, error: "User not found" } );splitlog( debugNamespaceLogger: Function, options?: {
port?: number,
host?: string
} ): FunctionIf no options are provided, the logger reads the current listener port from /tmp/splitlog_channel.
PRs welcome! If you want to suggest a feature or report a bug, please open an issue.
