moving average trading model
- Analysis:
graph:
This is a module to do technical stock analysis. User can define their own stock and graph the base graph out from this model. This module includes pandas, numpy and matplotlib library. Before using this module, please make sure you have those library installed on your machine.
Download historical stock prices by using below function: get_data(ticket, startdate, enddate, source='yahoo') This function will download the historical stock price to your local machine(same folder) as csv file.
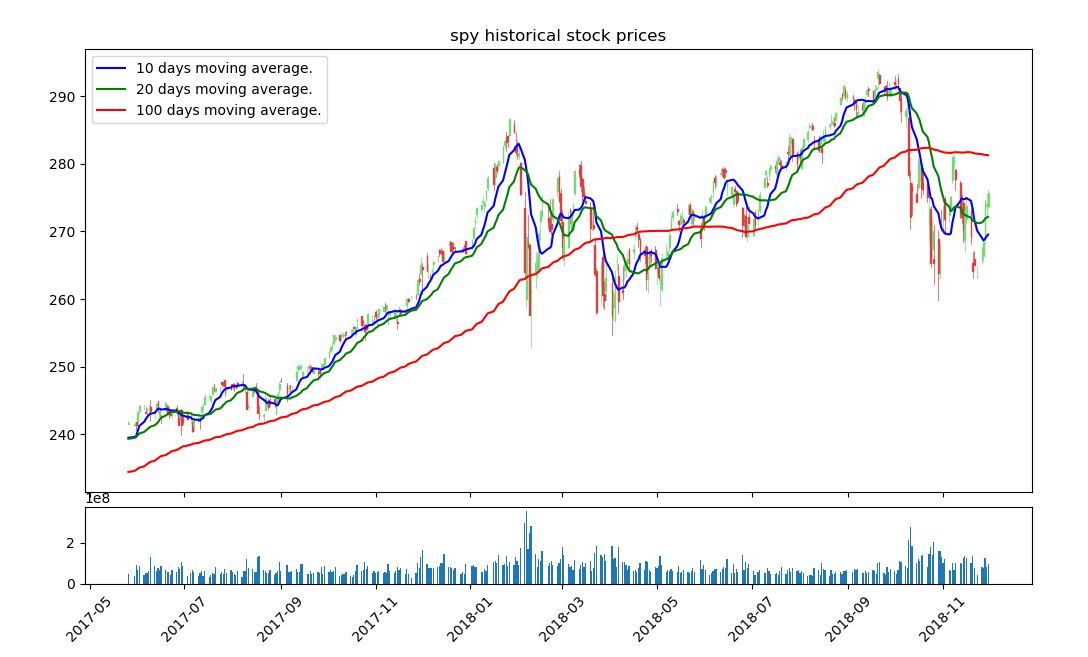
Graph histroical stock prices data by using below function: graph_data(ticker, mvs) This function do the graphing of a ticker with the moving average (mvs) user defined. Sample output:
graph_data('spy', 10, 20, 100) Below is the sample image out from the function. It created 10, 20, 100 days moving average of stock spy for the period of user defined period from the get_data function.
- Trade:
mv_trade (moving average trading)
Model include moving average trading algorthmic, this algo applies trading method (long / short) by using moving average as entry and exit signal. For instance, if fast moving average is lower than slow moving average, return short sigal . Reverse verse, if slow moving average is lower than fast moving average, return long sigal. This trade model include the position size, lot size and ticker. Model will first downloads the historical price of user defined ticker then applies the trade signal based on the close price.
Function included:
- pnl: return historical running pnl with pandas DataFrame.
- total_pnl: return historical total pnl (net pnl).
- total_capital: return historical pnl (net pnl) plus running capital.
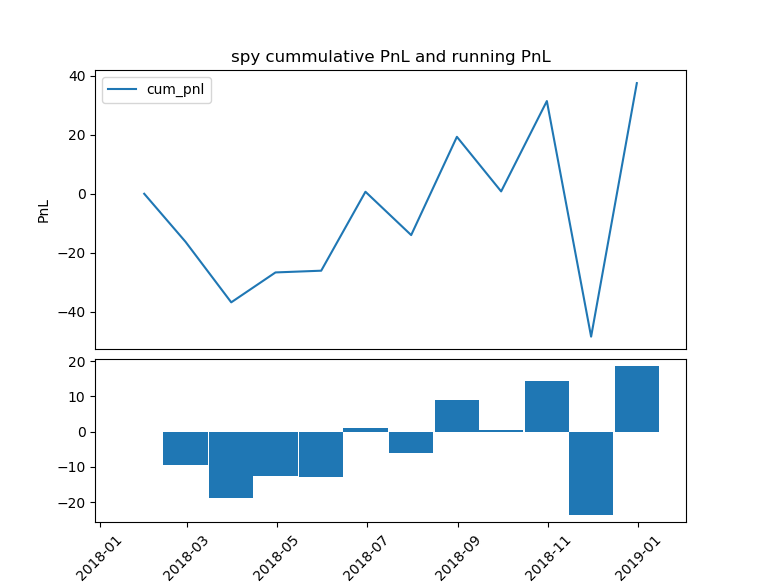
- graph_pnl: graph the historical pnl with line chart and bar chart. User can aggregate the segmentaion by applying pandas time function. For instance: D: day, M: month. Due to the limitation of the data, the least segmentation is by day.
- graph_pnl example below:
Excel model: Moving average trading algorithm by using spv data from 2018-01-01 to 2018-12-31. Fast moving average is 10 days, slow moving average is 20 days. Demonstration of how the calculation works.
- Risk management:
The risk calculation is based on the daily return of the stock's close price (today price - prior date price) / today price.
This model includes risk management function. Convariance matrix calculation and Monte Carlos simulation. Both methods can return VaR ( Value at Risk) for user defined portfolios.
The convariance matrix calculation takes the position of the user's portfolio and the convariance of the portfolio. The Monte Carlos simulation takes the Cholesky Decomposition matrix of the convariance with the random normal distribution.