Grid makes use of the
CSS grid
to make creating dashboard-like layouts super easy in Dash.
ControlPanel adds a panel to the side of the grid which contains input components to change the state of the plot grid.
This example is found in simple_demo.py
First we add the external css url https://codepen.io/rmarren1/pen/mLqGRg.css.
This is necessary for the grid to work. If you cannot use this (e.g. you
are serving stylesheets locally) you can just serve the file at https://github.com/rmarren1/dash-ui/blob/master/dash_ui/style/css/grid.css .
Next, we create a grid with the following call:
grid = dui.Grid(_id="grid", num_rows=12, num_cols=12, grid_padding=5)
num_rowsis the number of rows in the grid, and must be between 1 and 12num_colsis the number of columns in the grid, and must be between 1 and 12grid_paddingis the number of pixels to pad between grid elements, and must be one of [0, 1, 2, 5, 10, 25, 50, 100].
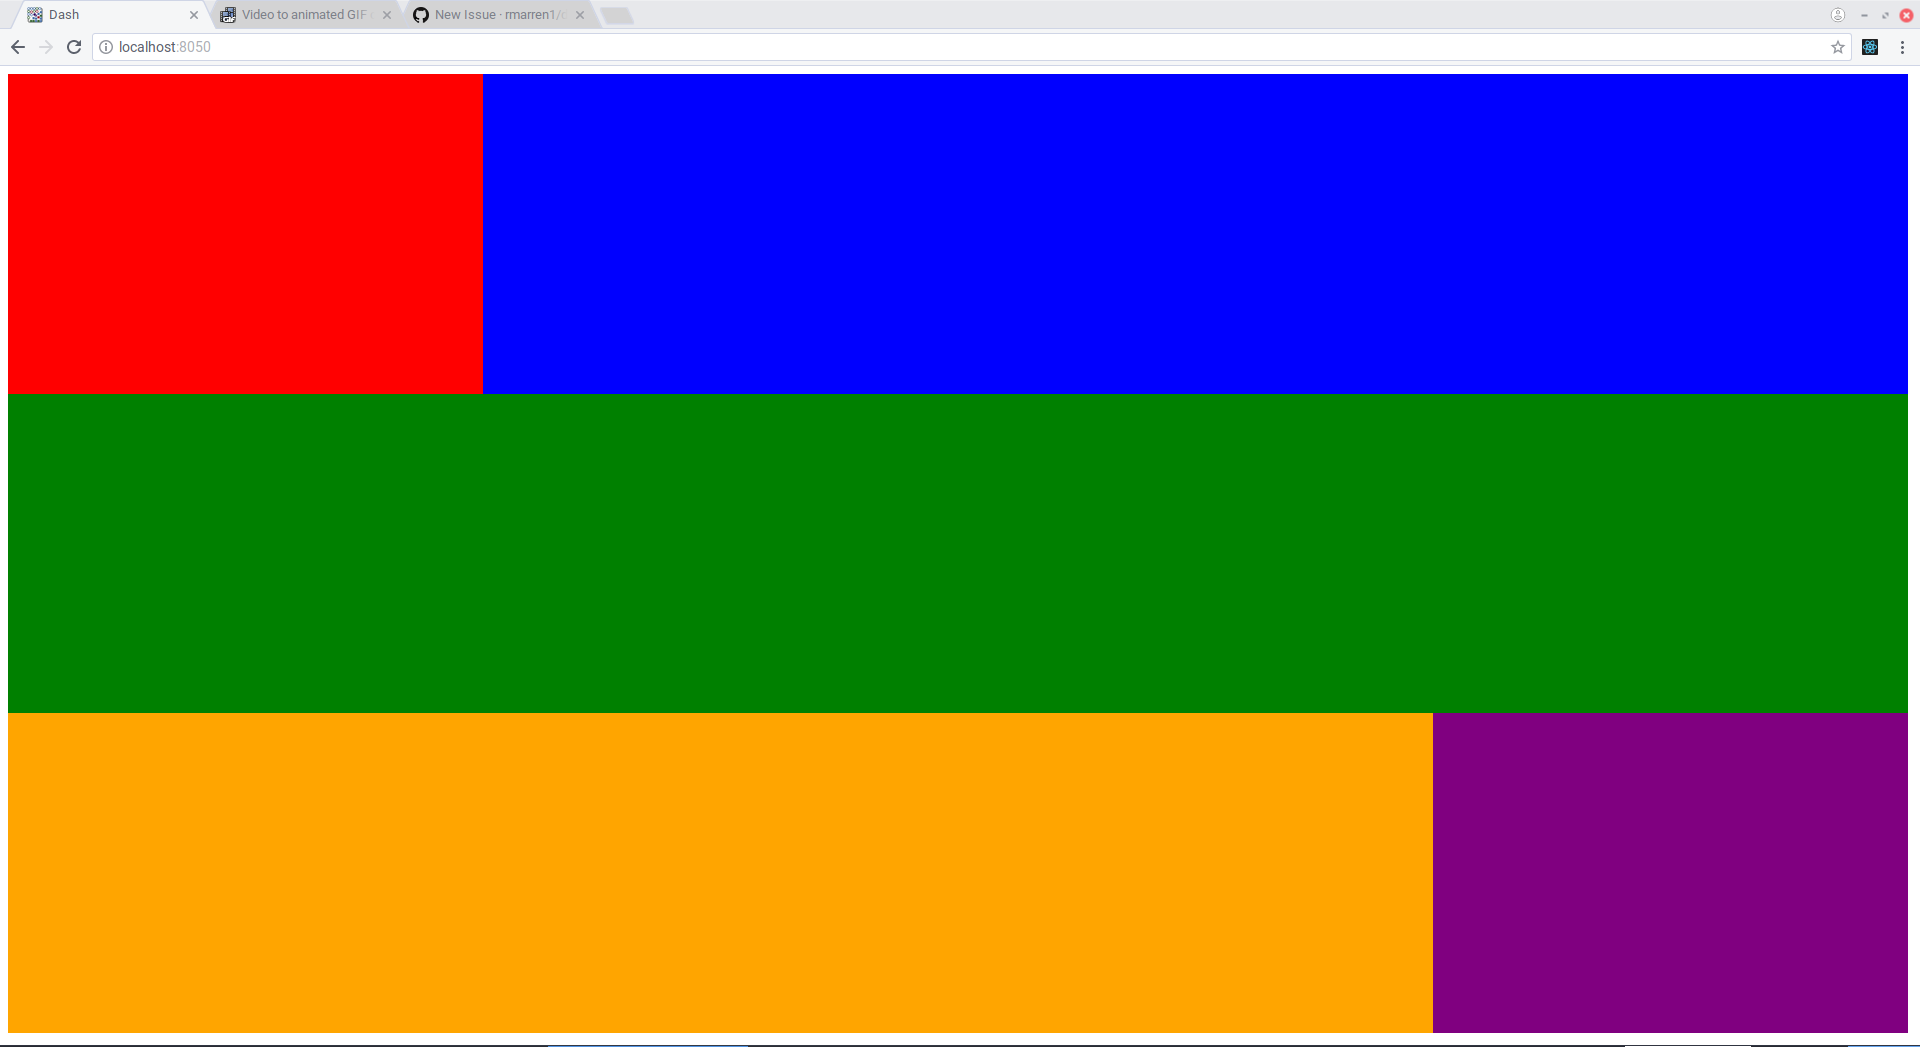
Now you can add any dash element as a grid element like so:
grid.add_element(col=1, row=1, width=3, height=4, element=html.Div(
    style={"background-color": "red", "height": "100%", "width": "100%"}
))
rowis the starting row in the grid layoutcolis the starting column in the grid layoutheightis the number of rows the element should span.widthis the number of columns the element should span
Note that the rows and columns are one indexed.
Finally, we create the layout using the function
dui.Layout(grid=grid,)
and set app.layout as the object this function returns.
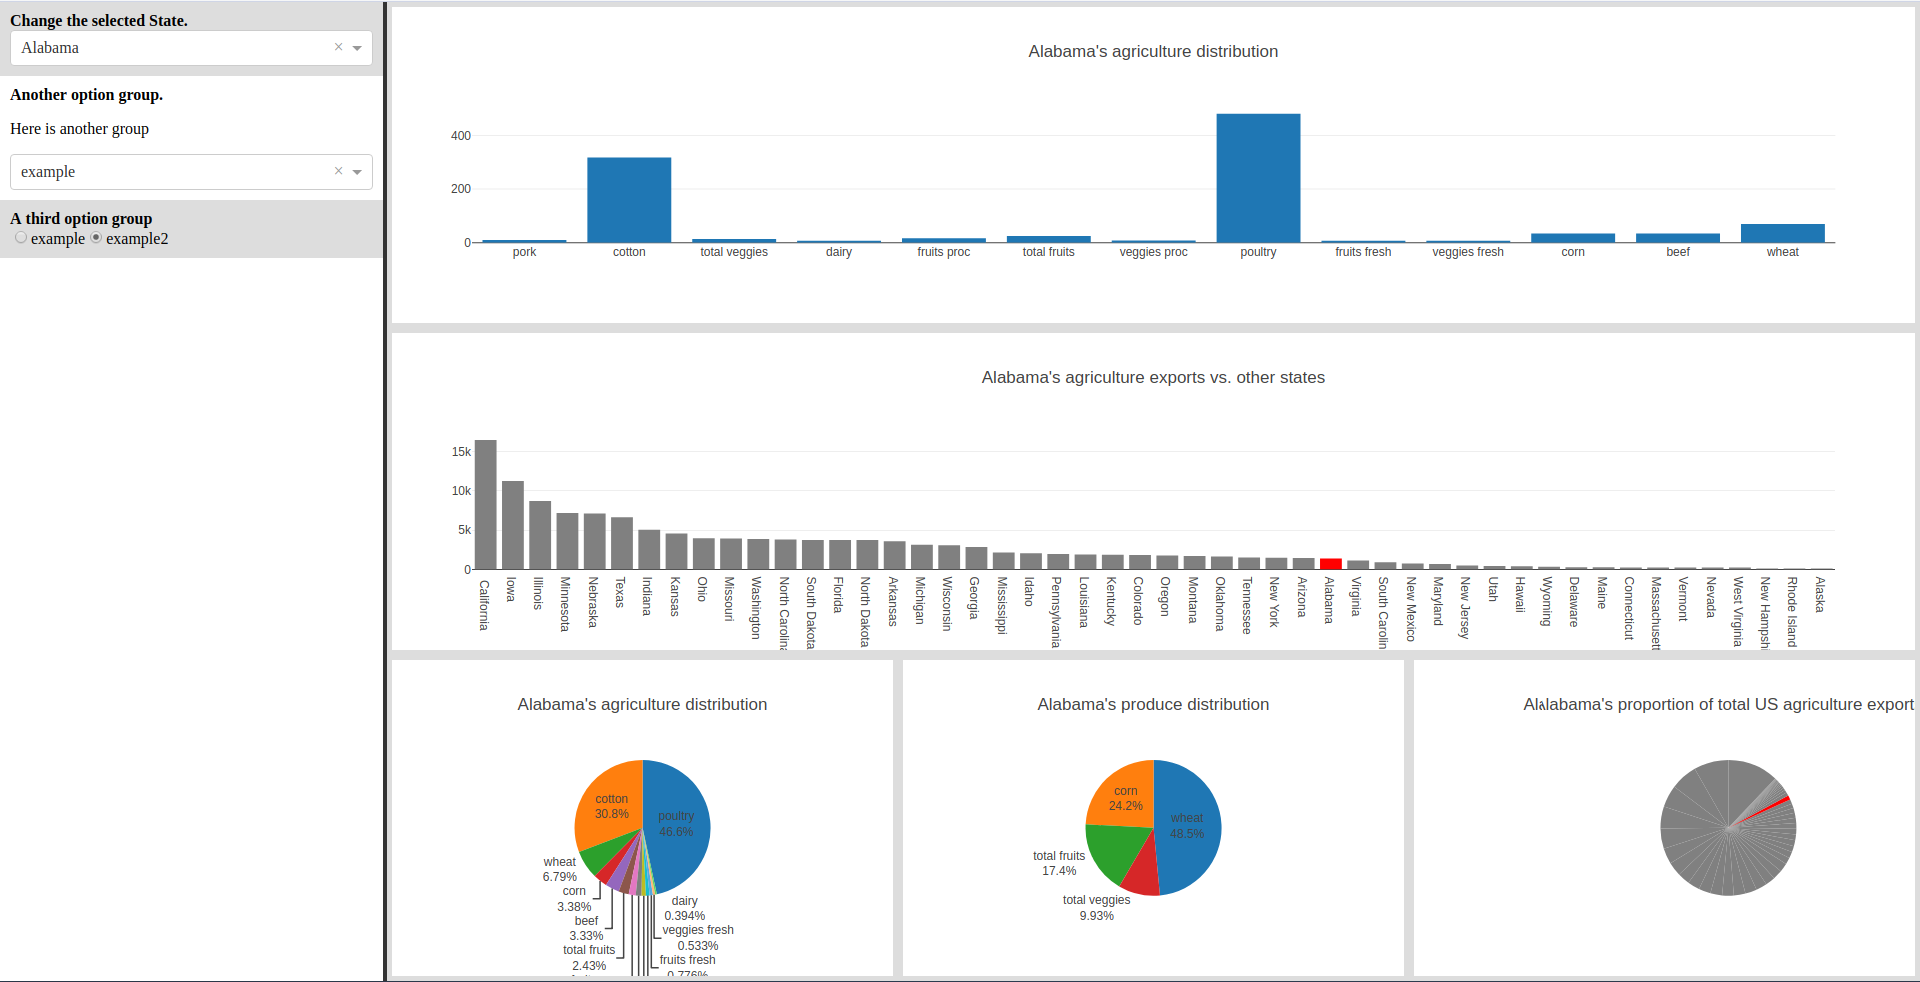
This example shows the grid with real plots (see advanced_demo.py)
If a ControlPanel is not included, the grid will take up the entire screen.
To include the ControlPanel, create one using code like the following:
controlpanel = dui.ControlPanel(_id="controlpanel")
controlpanel.create_group(
    group="State",
    group_title="Change the selected State."
)
state_select = dcc.Dropdown(
    id="state-dropdown",
    options=[{
        'label': x.title(),
        'value': x
        } for x in df["state"].tolist()
    ],
    value=df["state"].tolist()[0]
)
controlpanel.add_element(state_select, "State")
then include the controlpanel instance as an argument to the dui.Layout function, e.g.
app.layout = dui.Layout(
    grid=grid,
    controlpanel=controlpanel
)
We can also add plotly graph elements with the shortcut
grid.add_graph(col=1, row=1, width=3, height=4, graph_id="all-pie")
which creates a grid element with a graph with the id declared in graph_id.
We can end up with this really nice interactive dashboard, with only 200 lines of code.
To have your own flavor of dashboard, simply fork the source SASS here, make changes, then add the css from codepen to your project using:
my_css_urls = [
  "https://codepen.io/your-codepen-name/pen/your-pen-identifier.css",
]

for url in my_css_urls:
    app.css.append_css({
        "external_url": url
    })