Tracking tab optimizations + new dynamic legend widget #179
Conversation
|
The legend doesn't seem to be displaying on my Linux machine:
|
|
I'm seeing it on windows, not sure why it's not showing up on Linux, let me run it by the apps team and see what they think. I think in general we can make the font size smaller to make the legend less obtrusive, I know there's a lot of signals but it really covers a lot of display area on the chart. |
We could make it single column scrollable - that's another thing we can adjust. |
I was initially having trouble with it showing up on Windows too. The way I calculate the column widths is a little complicated, since I base it off of the actual implicitWidths of the cells in the gridview (which is the colored rect plus the text). Is there some fixed width of cell I can go with that would simplify that calculation? |
!! I apparently didn't push my last commit. I already had a fix for a legend that didn't show. This should show properly (though I think it's overly complex in how it determines how wide the legend should be). |
ec6b26c to
85e4ccc
Compare
There was a problem hiding this comment.
From comments by others on slack (I believe this was the consensus, correct me if you heard otherwise):
- Leave in the ability to shade/hide the legend
- Display by default (already done)
- Disable ability to move the legend
- Scollable if it overflows the max of 2 columns
| } | ||
| } | ||
| } | ||
|
|
There was a problem hiding this comment.
The checkboxes seem to have disappeared for me
|
If you merge in tip of tree you may see performance boost. I believe there was a regression introduced that was fixed in: |
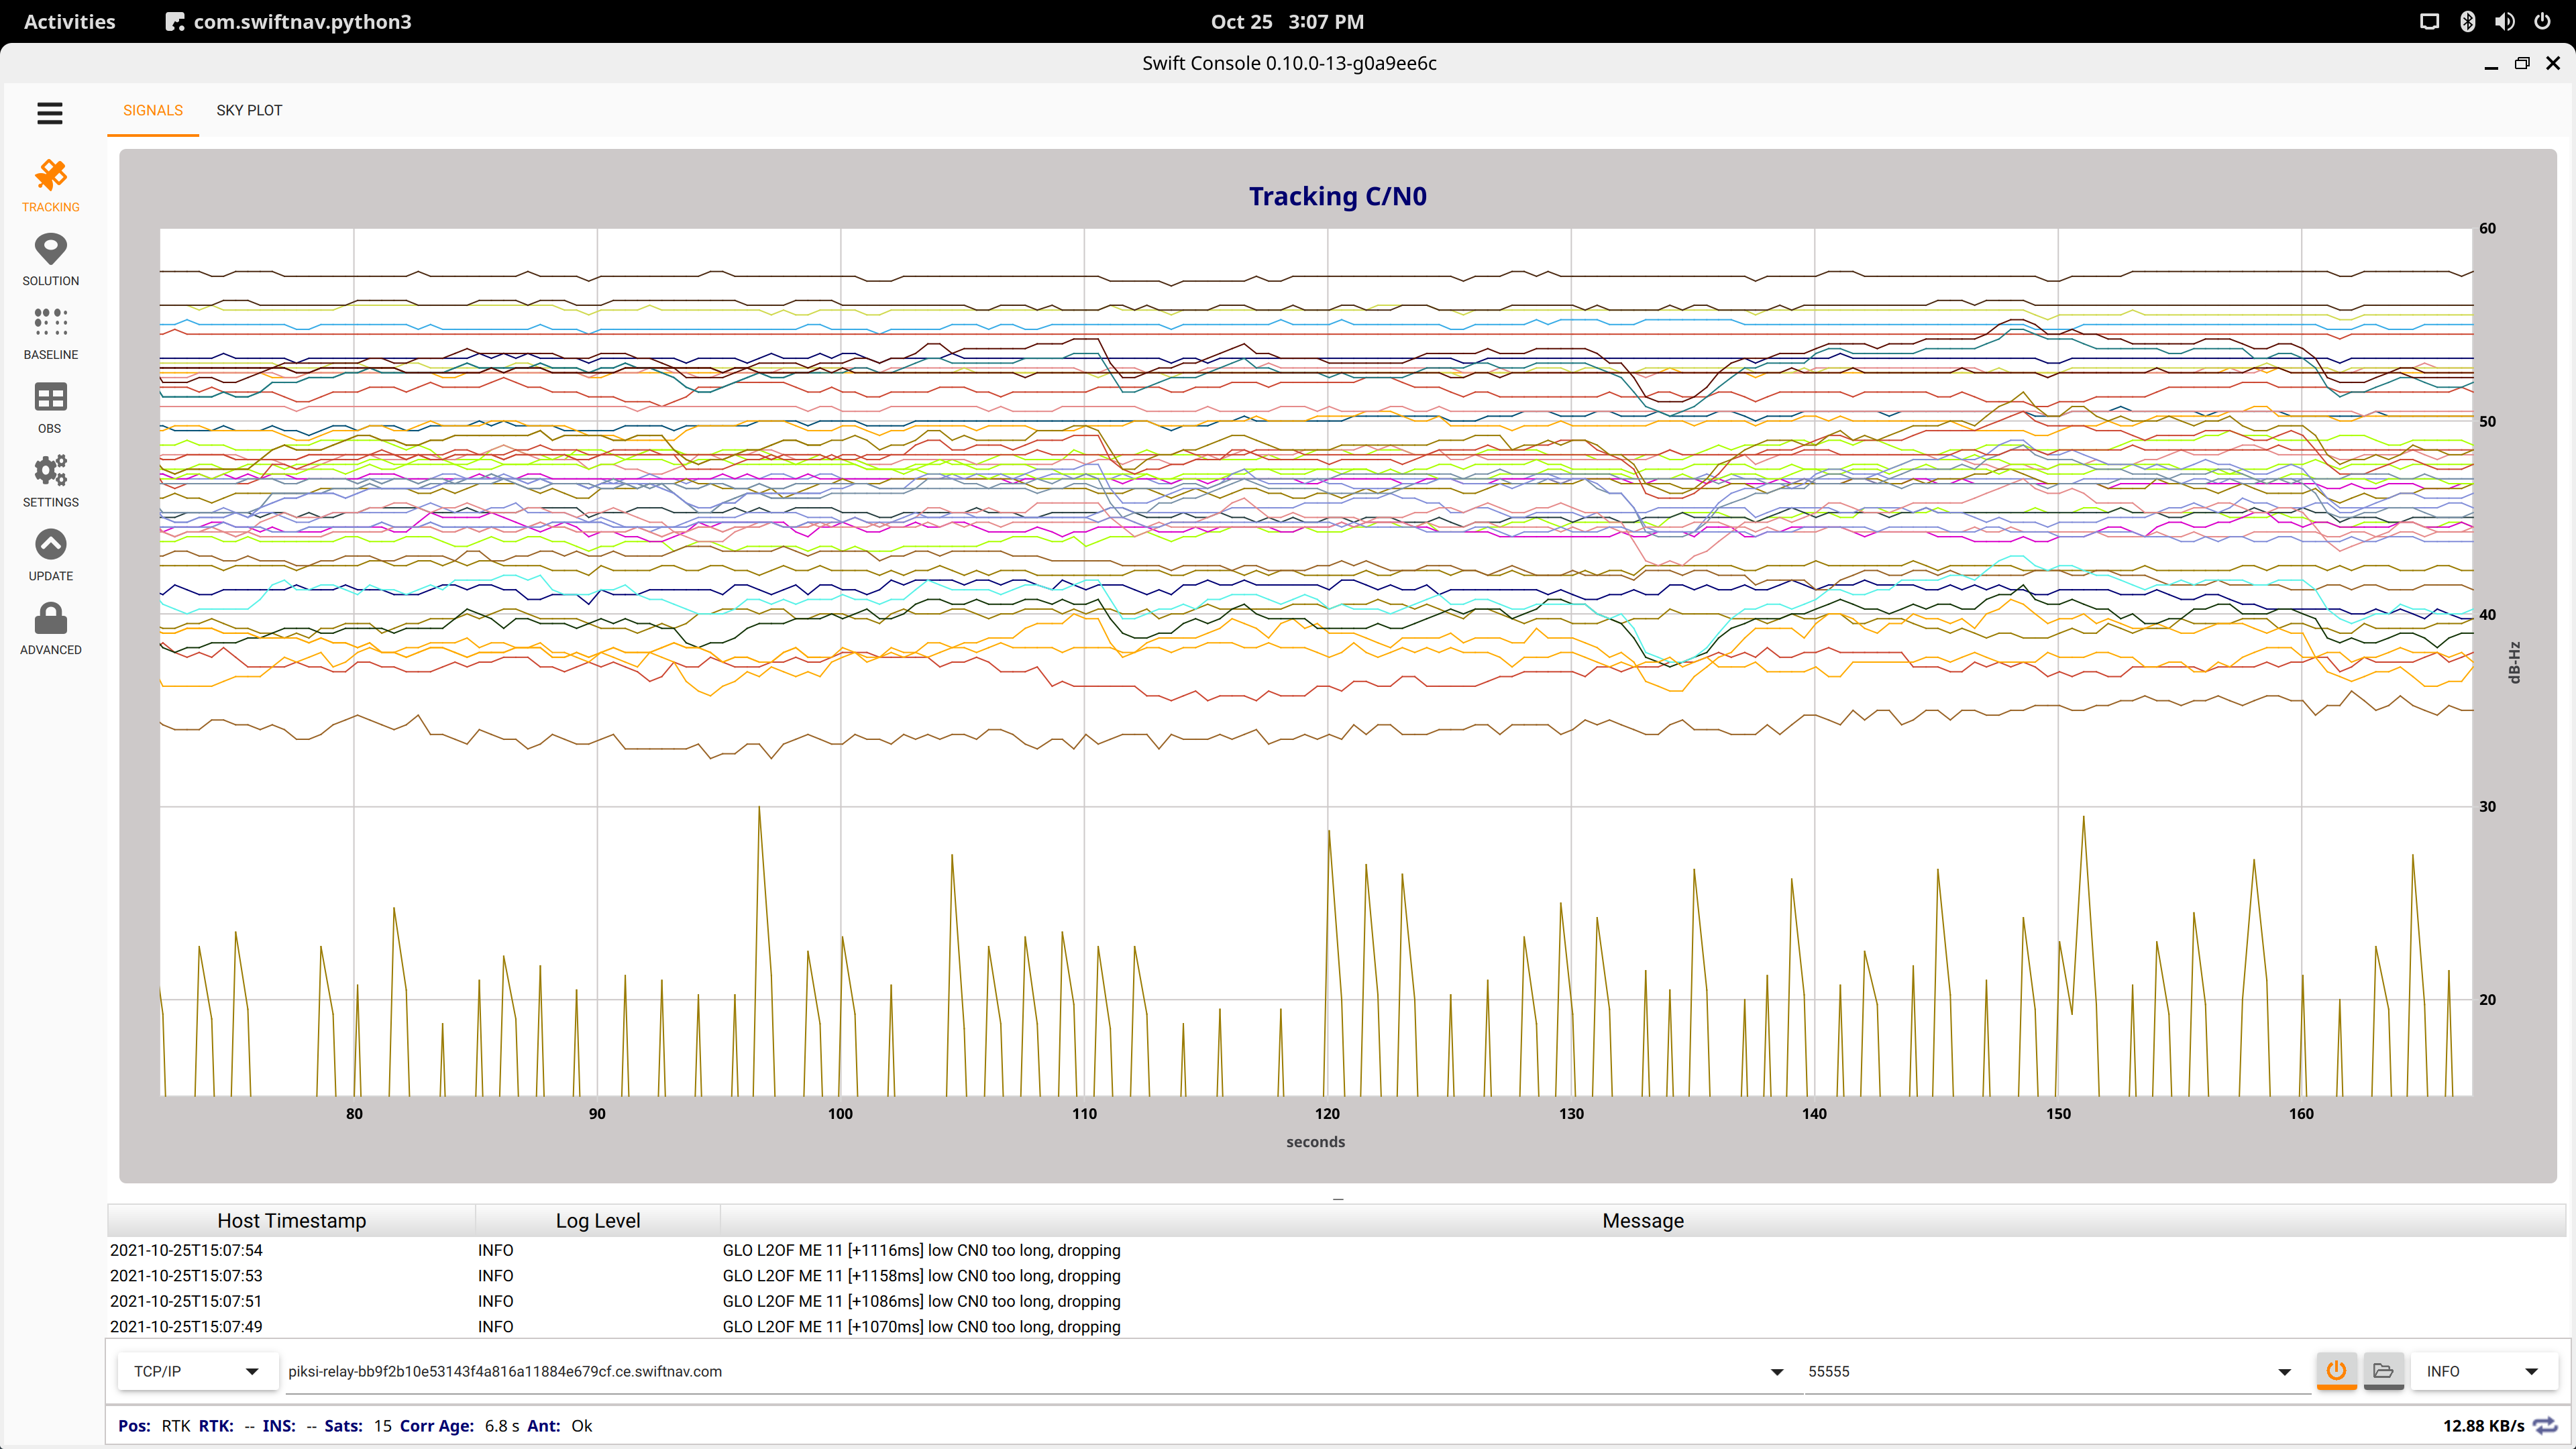
This is the first iteration of optimizing performance of the
TrackingSignalsTab.

Series' are created only once in QML, to associate them with the chart.
Thereafter, the series' persist. Points are replaced and properties are
set with each fill_all_series call - which occurs regularly as called by
a timer from QML. The update mechanism remains unchanged.

Legend seems broken with the changes I have put in here - despite my
having attempted to accomodate it.
* This fixes my prior changes so the Tracking Signals tab legend
  actually shows (make an all_series changed notify signal, and emit it
  when the series changes, so the legend knows when to update.
* This reimplements the legend so it looks nicer, based on guidelines
  from Jason. Maximum two column and scrolling when things don't fit.
* Legend can be moved around the chart (drag title bar)
* Legend can be hidden to show chart more clearly (click title bar)

Rebase: Chart is not filling properly...
* Fix formatting issues
* Clarify that IndexError is expected in fill_all_series
* This adds a notify property to all of the properties in the
  TrackingSignalsPoints object that did not have it. The lack of the
  notify property was preventing QML from seeing the changes in those
  properties, and thus the checkboxes were not being populated in the
  UI.
* Instead of putting the chart and checkboxes in a Rectangle with
  anchoring, instead use a ColumnLayout. No need for the container to be
  visible, and it's better if it manages the height of the children.
* Cell width and height is now not dynamically calculated per cell, but
  based off reference cell contents, reducing complexity.
* Legend now resizes as small as it can to the number of series
  elements.
* Still keeps maximum of 2 columns, scrollable beyond that.
* This adds some of the SwiftOrange color styling to the TrackingSignals
  tab.
* Remove redundant anchoring, use ColumnLayout in legend shade bar and
  legend grid
85e4ccc to
ad18e9f
Compare
|
Ok, I think this is in a state that it can be merged. |
Reduce the font size we use for the Tracking Signals legend per Jason
Mobarak's request.
|
Everything visually looks great to me! I have two concerns.
|
trailing-series.mp4 |
If this was a pre-existing bug, let's leave it for another PR... but what I'm seeing is a mix of behavior, some of the lines are completely hidden when the checkbox is toggled off and some of the lines turn in to "trailing lines" (almost as if there's two different series drawing the same visual line):
Agree, we should make the following changes:
|
|
Going to merge this, we'll need to create a new PR to follow-up on these requests: #179 (comment) |
Follow-up task: #196 |
This optimizes series creation in the Tracking Signals tab.
This reimplements the legend in the Tracking Signals tab