[CPP-49][CPP-143]Added the Advanced INS tab (minus fusion engine statusbar) and fixed Tracking Signals artifacts using PGM. #67
Conversation
 john-michaelburke
commented
john-michaelburke
commented
Jun 7, 2021
- Added Advanced INS tab (going to push the fusion engine status bar into a separate PR).
- Added the changes to allow the user to open this tab from command line.
- Added better approach for scaling the x axis for Tracking Signals which should resolve the noticeable artifacts during PGM/STEP(haven't tested on step yet).
|
I'm going to make another smaller PR before the release today/tomorrow to add these: |
| line.color = Constants.advancedIns.lineColors[idx]; | ||
| line.width = Constants.commonChart.lineWidth; | ||
| line.axisYRight = advancedInsYAxis; | ||
| line.useOpenGL = Globals.useOpenGL; |
There was a problem hiding this comment.
every line needs an useOpenGL?
There was a problem hiding this comment.
I believe so. Here is the oscilliscope qml example. You can see they set it for each lineseries instance:
http://www.bim-times.com/qt/Qt-5.11.1/qtcharts/qtcharts-qmloscilloscope-qml-qmloscilloscope-scopeview-qml.html
| point_val.set_y(points[idx]); | ||
| } | ||
| } | ||
| let text_data = { |
There was a problem hiding this comment.
they are not text anymore, so ... text_data isnt a great name. Also appears in this PR as TEXT_DATA
There was a problem hiding this comment.
Done. I switched the context to refer to them as fields now.
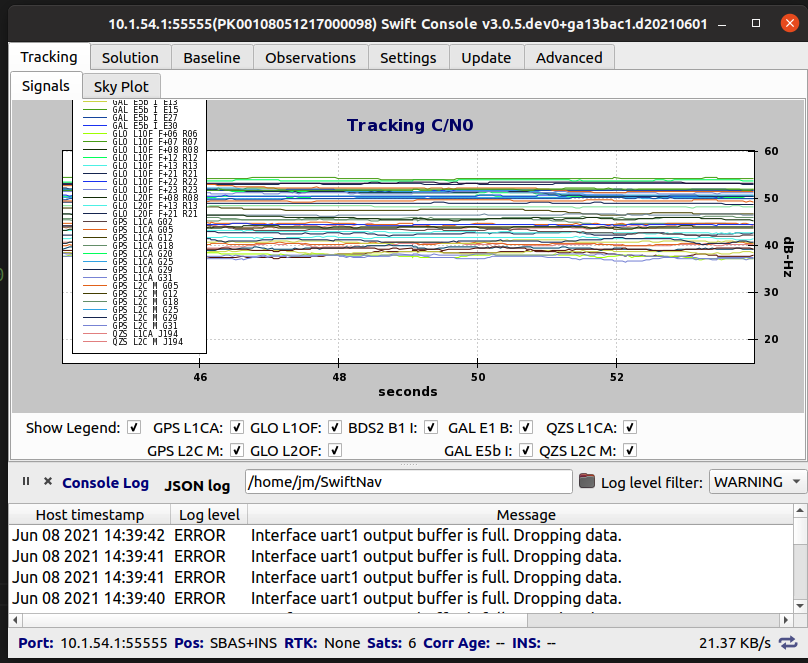
Yes this is kind of an interesting problem. The old console AFAIK was only storing NUM_POINTS=200 for the tracking signals plot. From what I can see we are recording points from the pgm significantly faster than the old console so the time it takes to hit the 200 points is shorter and the axis is much shorter. I could try increasing the number of points we store but we will be at some disadvantage in terms of performance comparison against the original console. Maybe bump it up to 400 for PGM? For comparison, the piski takes about 100 seconds to fill up 200 points for both the old console and the new console. I think this is related to the message type's slower data rate(measurement state vs obs/tracking). For PGM it takes 10 seconds for the new console to fill up 200 points whereas the old console it looks like 60seconds to fill up 200 points which I believe is due to python being less efficient or some filtering of some sort. I cannot find where in the code they actually switch behavior based off the PGM though so all of this is speculation, I'm not sure if you know where it is. Maybe @dgburr you would know? |
10.1.54.1 is a Piksi though, not a PGM |
This line is probably the filtering causing the smaller data resolution for this device which we decided to remove in the new console: It looks like the measurement state message was filtered out on this device causing it to rely on msg_obs. I reverted it and it is now relying on measurement_state messages. |
The difference is that the Piksi is using a dedicated message (MSG_TRACKING_STATE) to communicate measurement information whereas the PGM/STEP are using the raw data from the RTCM messages converted into SBP (i.e. MSG_OBS messages). |
It isn't "filtered out": it simply doesn't exist. The Piksi is both an ME and a PE, meaning that it generates lots of useful metadata from the ME to populate the tracking tab (CN0, azimuth, elevation, etc). The PEP/STEP are a third party ME + Starling PE, which means that the only tracking information we have access to is whatever can be extracted from the raw observations (which are converted into MSG_OBS messages). So we get CN0, but not azimuth and elevation (which means no Skyplot is possible). |
|
I went back through and disabled the message 97 (measurement_state) on 10.1.54.1 and now it is matching the behavior we have in the new console. I'm not really sure how this could be different, it's as if new console was using a different interface to the piksi compared to the old console which had differing message filters. |
This is were @dgburr, @ebethon or @switanis could help, I think our options are:
The current console uses strategy (2) -- updates outside of the GUI update period are thrown away.
As you already pointed out, we "fill up with points" faster, but this is because the old console is decimating data when it's outside of the GUI update period.
This is the commit that added support for populating the tracking view from MSG_OBS: swift-nav/piksi_tools@8a360d9 -- the blame/praise view in GitHub is a good way to find these sort of things |
We need to be handle devices emitting any subset of messages, so Piksi emitting only message 97 is a valid use case (which is the current state you have 10.1.54.1 in) -- but in this configuration the tracking view flies by too quickly to be useful IMO. So, again, we need a decision about what tradeoff to make regarding storing more points vs decimation/interpolation. |
As we discussed in our stand-up I think the plan of record for now should be to implement decimation as the current console does, we can implement a different strategy as a follow feature depending on the feedback we get from @swift-nav/appseng |
|
Added the 0.2second update threshold and it pushes out the axis to ~45seconds. It looks a lot better now. |
| #[strum(serialize = "LOG_LEVEL_LABELS")] | ||
| LOG_LEVEL_LABELS, | ||
| #[strum(serialize = "TEXT_DATA")] | ||
| TEXT_DATA, |
There was a problem hiding this comment.
Good catch! When we get in the remaining changes to strum to make the lazy_statics public I'll set up a catch for this in our CI.
There was a problem hiding this comment.
Looks a lot better indeed, when I connect to 10.1.54.1 though I don't see the obs tab updating-- if I connect to another device first I do see the tab updating-- the remote obs tab remains static though (with stale data?) |
I decoupled the tracking signals tab from the observation tab so this may be a bug with the observation tab. That being said currently we don't have any mechanism for clearing charts between connections and if one connection would populate a tab but another connection would not the stale data would remain. Maybe you can show me tomorrow. |
|
@silverjam I found what you were referring to and good catch. I had added a change recently only showing visibility if data was flowing in. I had added the gate to the remote observations whereas I think the local are more guaranteed. So I through the visibility check into both of them. |
837a387 to
b504b02
Compare
I don't think that's necessarily an issue: we just cover a shorter period of time, but we don't need multiple minutes of history. We can keep it as is for now and plan to add a decimation/averaging function later or just a setting for the maximum number of points. |