Feature: Make the ticks on the solution plot land on "nice" numbers [CPP-738] #899
Conversation
|
Frontend and Release Workflow Started here |
|
@adrian-kong I thought of two more cases where you could have too many ticks:
I refactored the fixing of the ticks to the I plan on merging as soon as the code quality check passes. |
|
Frontend and Release Workflow Started here |
|
LGTM. Not sure how the two approaches would clash or if you want to look into it here or in a separate PR. But the lead apps engineer had requested we fix the scale between axes at some point. I think the "niceness" stuff would still apply but we would want to maintain a hard ratio between the two axes. Maybe 2:1 or something anticipating the ranges of latitude and longitude ie -90 to 90 and -180 to 180. |
|
@john-michaelburke The ticket was unclear to me as it was "force a fixed interval for both axes", which this PR does. Although as you said, the interval is not the same across the axes. I guess what you're saying is what the author meant was "force the x and y axes ticks to share a fixed interval". I will refactor this PR so that the tick intervals are the same across the axes. I still have questions about what you mean w.r.t. fixed interval, do you want it so that the tick intervals are the same in the x and y axis? or do you want it so that the tick intervals are the same & also that the aspect ratio of the plot is 1 (i.e. intersecting ticks would make perfect squares on the users screen). I don't feel strongly about the desired behavior but since there is some ambiguity IMO i am going to refactor this to have a shared interval and would prefer to the aspect ratio stuff in separate PR & ticket. |
|
This code makes it so the ticks have the same range but doesn't force aspect = 1. It would be pretty easy to refactor to make it have a fixed ratio other than 1 and/or a fixed aspect. Let me know the product owner I should talk to get feedback on the feature request... But I want to do that as a separate ticket & PR |
This seems inline with my thoughts @pcrumley so LGTM. If you want to get final approval you can reach out to @switanis, Stefan Witanis probably through slack and he will tell you exactly what needs to be changed if at all. |
|
Frontend and Release Workflow Started here |
This PR closes CPP-738 and makes is so that instead of grid lines landing in arbitrary places, they will land on "nice" numbers. The algorithm to find said nice numbers is taken from: https://stackoverflow.com/questions/8506881/nice-label-algorithm-for-charts-with-minimum-ticks
Overall that part of the code is pretty straightforward, and I severely underestimated this ticket. The reason being that if you drastically change the range of plot without being careful, you may try to render a zillion ticks and you will lock the GUI. I thought it was enough to just have the ticks be on the
onRangeChangedslot of the valueAxis and go from there, however, due to some unknownst to me nature of QML code render loop, there can still be race conditions.Instead I needed to find everywhere in the code where the chart range could drastically change fast enough so that the plot would render more than ~10 ticks, freeze the ticks before the range is changed, and unfreeze afterwards. Turns out there are two places this could happen
when updating the line data, if there is a new point that >> or << the previous min, you will need to freeze the ticks. This is easy to induce by changing the units from degrees, where tick interval is ~.0001 or so, to meters, where is it ~0.1. But the problem is more general than that. This is handled in timer loop, where we fix the ticks whenever we have data, and then we get the good ticks, after we reset the chart zoom.
If the user spins the mouse wheel really fast, simply updating the ticks at the timer is not enough and it can get laggy. I freeze the ticks before and after zoom multiplier is applied.
I feel pretty confident that I caught all of the places it could go wrong, and I don't see a perf hit on my mac. That said, I'm a QT neophyte, and I don't know how to carefully measure frame-rates on the before and after.
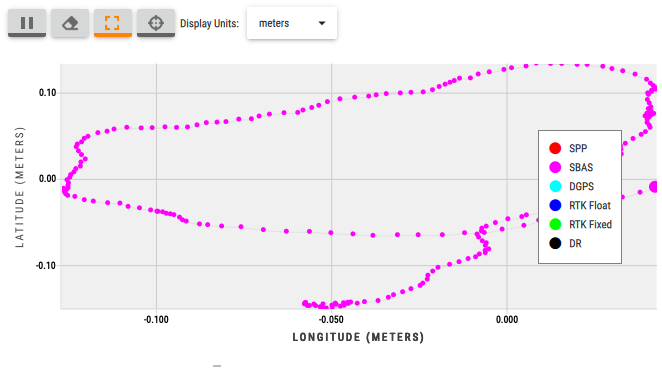
Here is an image of the difference in the ticks
before:
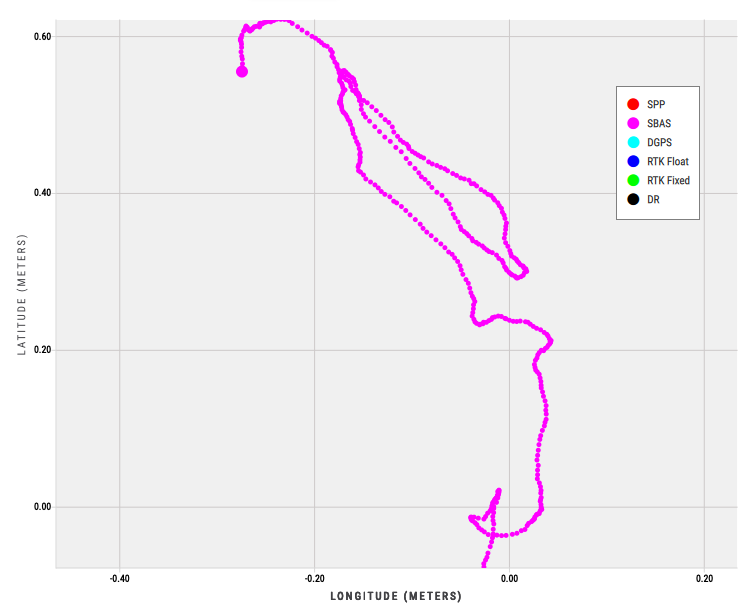
after: