Applied Bioinformatics Core, WCMC
Here, you can find some additional scripts that go beyond the course notes and show you how some of the images were produced.
return to course material website at WCMC
We aligned 2x48 yeast samples (2 conditions: WT and SNF2) and wanted to compare the results of the STAR alignment across all 96 samples.
The result can be seen in the pdf file, which can be recreated by running the 01_Alignment_visualizeSTARresults.Rmd file, for example using RStudio.
You can find all the functions and commands used to:
- read in the STAR log file
- combine the log files for several samples
- make data frames suitable for ggplot2 plotting
- combine various ggplot2 figures into one image
This is a simpler exercise than the STAR log file visualization.
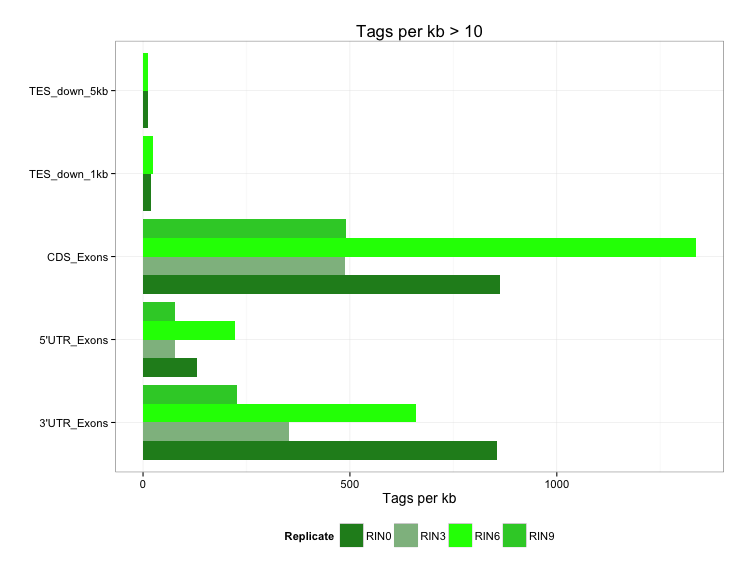
If you want to reproduce the figure 02_barplot_readDistributions.png, download the .txt files from the folder 02_readDistribution_input and carry out the steps detailed in the .R script.
This, too, is a very simple R exercise to reproduce figure 03_boxplots_TIN.png
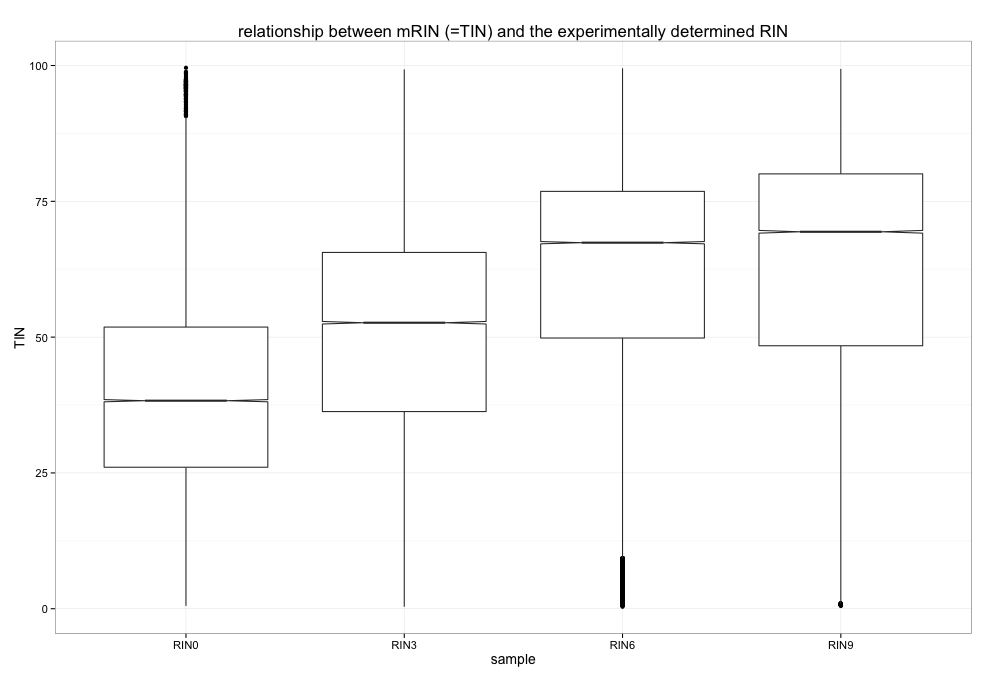
RSeQC's TIN module was run on 4 different BAM files, each obtained from human RNA-seq experiments where the RNA quality was deliberately modified to generate RINs of low (0), medium and high (9) quality. In principle, the in silico determined TIN score should correlate very well with the original RIN.
RSeQC's output files are .xls files, which you can find in the respective folder.
Download those files into your working directory as well as the .R script and have a go at the boxplots.