add a simpel export button to download the current data frame #126
Conversation
|
Thanks Sam! Maybe you can give a quick demo at the viz meeting tomorrow? |
| filter(ahead %in% horizon) %>% | ||
| filter(forecaster %in% forecasters) | ||
| if (loc != TOTAL_LOCATIONS) { | ||
| scoreDf = scoreDf %>% filter(geo_value == tolower(loc)) |
There was a problem hiding this comment.
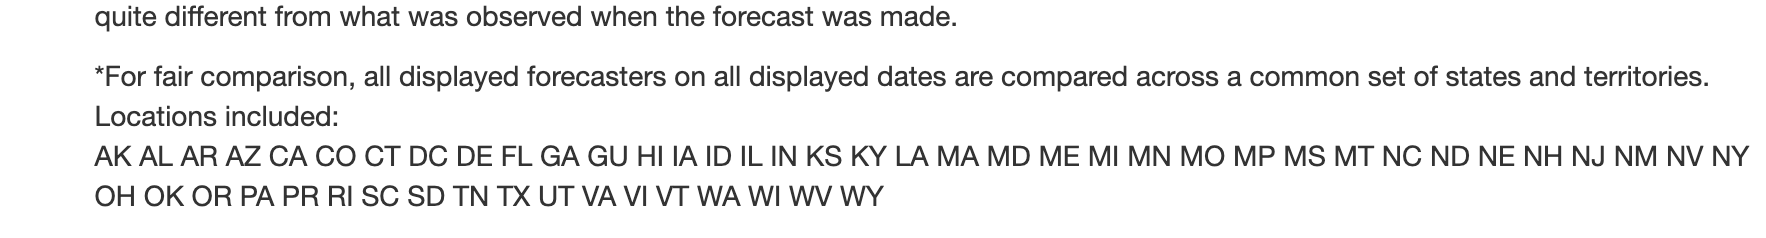
I'm wondering if we should include somewhere what locations are included when the user has selected total locations (not all of the locations are included - it is based on what forecasters are selected and which locations they have in common). But maybe that is not necessary...
There was a problem hiding this comment.
how is this information currently shown in the user interface?
There was a problem hiding this comment.
Currently it is shown at the bottom like this:
what do you mean? you press the button, you get the CSV. |
| filter(signal == signalFilter) %>% | ||
| filter(ahead %in% horizon) %>% | ||
| filter(forecaster %in% forecasters) | ||
| if (loc != TOTAL_LOCATIONS) { |
There was a problem hiding this comment.
It seems that if loc == TOTAL_LOCATIONS, this download actually includes all locations. The downloaded file (with just the initial selections on app load selected) included AS, although it technically shouldn't since the baseline nor ensemble forecasters have data for that. It also technically shouldn't include the US, since that is not included in the plot either.
There was a problem hiding this comment.
There is probably a cleaner way of doing it, but this is what I did in the app to find and reduce by the locations that all forecasters have data for:
      locationDf = filteredScoreDf %>% group_by(Forecaster, Week_End_Date, ahead) %>%
        summarize(location_list = paste(sort(unique(geo_value)),collapse=","))

      # Create a list containing each row's location list
      locationList = sapply(locationDf$location_list, function(x) strsplit(x, ","))
      locationList = lapply(locationList, function(x) x[x != 'us'])

      # Get the intersection of all the locations in these lists
      locationsIntersect = unique(Reduce(intersect, locationList))
      filteredScoreDf = filteredScoreDf %>% filter(geo_value %in% locationsIntersect)```
There was a problem hiding this comment.
Also now that I am adding hospitalizations which require even more data preprocessing (because of the difference in how the aheads work) this export function will probably need even more adjustments and require more decisions of what we actually want to show (the raw data vs the processed/filtered data that is shown in the plot). I can bring this up in our next meeting to get thoughts on what we want users to download.
|
superseded by #143 |
my approach on #117
Allows to download the current filtered/selected data frame as CSV file with a progress handler
Moreover, it automatically removes some trailing white space and I extracted the export logic to its own file