add a simpel export button to download the current data frame #126
There are no files selected for viewing
This file contains hidden or bidirectional Unicode text that may be interpreted or compiled differently than what appears below. To review, open the file in an editor that reveals hidden Unicode characters.
Learn more about bidirectional Unicode characters
This file contains hidden or bidirectional Unicode text that may be interpreted or compiled differently than what appears below. To review, open the file in an editor that reveals hidden Unicode characters.
Learn more about bidirectional Unicode characters
| Original file line number | Diff line number | Diff line change |
|---|---|---|
| @@ -0,0 +1,5 @@ | ||
|
|
||
| COVERAGE_INTERVALS = c("10", "20", "30", "40", "50", "60", "70", "80", "90", "95", "98") | ||
| DEATH_FILTER = "deaths_incidence_num" | ||
| CASE_FILTER = "confirmed_incidence_num" | ||
| TOTAL_LOCATIONS = "Totaled Over States*" |
This file contains hidden or bidirectional Unicode text that may be interpreted or compiled differently than what appears below. To review, open the file in an editor that reveals hidden Unicode characters.
Learn more about bidirectional Unicode characters
| Original file line number | Diff line number | Diff line change |
|---|---|---|
| @@ -0,0 +1,42 @@ | ||
| source('./common.R') | ||
|
|
||
| create_export_df = function(scoreDf, targetVariable, forecasters, horizon, loc) { | ||
| signalFilter = CASE_FILTER | ||
| if (targetVariable == "Deaths") { | ||
| signalFilter = DEATH_FILTER | ||
| } | ||
| scoreDf = scoreDf %>% | ||
| filter(signal == signalFilter) %>% | ||
| filter(ahead %in% horizon) %>% | ||
| filter(forecaster %in% forecasters) | ||
| if (loc != TOTAL_LOCATIONS) { | ||
| scoreDf = scoreDf %>% filter(geo_value == tolower(loc)) | ||
|
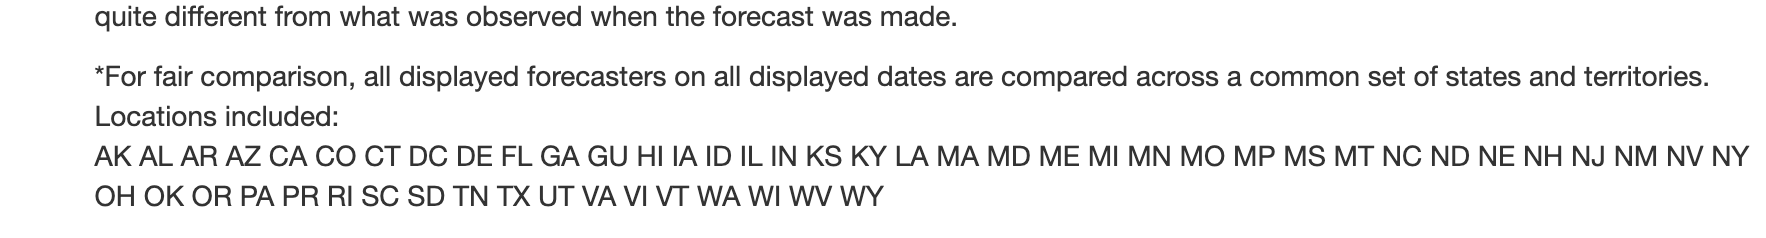
There was a problem hiding this comment. I'm wondering if we should include somewhere what locations are included when the user has selected total locations (not all of the locations are included - it is based on what forecasters are selected and which locations they have in common). But maybe that is not necessary... There was a problem hiding this comment. how is this information currently shown in the user interface? There was a problem hiding this comment. Currently it is shown at the bottom like this: |
||
| } | ||
| return(scoreDf) | ||
| } | ||
|
|
||
| export_scores_ui = div( | ||
| downloadButton("exportScores", "Download CSV") | ||
| ) | ||
|
|
||
| export_scores_server = function(input, output, df) { | ||
| output$exportScores <- downloadHandler( | ||
| filename = function() { | ||
| filename = paste0("forecast-eval-scores-", input$targetVariable) | ||
| if (input$location != TOTAL_LOCATIONS) { | ||
| filename = paste0(filename, '-', input$location) | ||
| } | ||
| paste0(filename,'-', Sys.Date(), ".csv") | ||
| }, | ||
| contentType = 'text/csv', | ||
| content = function(file) { | ||
| withProgress(message = 'Preparing export', | ||
| detail = 'This may take a while...', value = 0, max = 2, { | ||
| out_df = create_export_df(df, input$targetVariable, input$forecasters, input$aheads, input$location) | ||
| incProgress(1) | ||
| write.csv(out_df, file, row.names=FALSE) | ||
| incProgress(2) | ||
| }) | ||
| } | ||
| ) | ||
| } | ||
Add this suggestion to a batch that can be applied as a single commit.
This suggestion is invalid because no changes were made to the code.
Suggestions cannot be applied while the pull request is closed.
Suggestions cannot be applied while viewing a subset of changes.
Only one suggestion per line can be applied in a batch.
Add this suggestion to a batch that can be applied as a single commit.
Applying suggestions on deleted lines is not supported.
You must change the existing code in this line in order to create a valid suggestion.
Outdated suggestions cannot be applied.
This suggestion has been applied or marked resolved.
Suggestions cannot be applied from pending reviews.
Suggestions cannot be applied on multi-line comments.
Suggestions cannot be applied while the pull request is queued to merge.
Suggestion cannot be applied right now. Please check back later.
Uh oh!
There was an error while loading. Please reload this page.
There was a problem hiding this comment.
Choose a reason for hiding this comment
The reason will be displayed to describe this comment to others. Learn more.
It seems that if loc == TOTAL_LOCATIONS, this download actually includes all locations. The downloaded file (with just the initial selections on app load selected) included AS, although it technically shouldn't since the baseline nor ensemble forecasters have data for that. It also technically shouldn't include the US, since that is not included in the plot either.
There was a problem hiding this comment.
Choose a reason for hiding this comment
The reason will be displayed to describe this comment to others. Learn more.
There is probably a cleaner way of doing it, but this is what I did in the app to find and reduce by the locations that all forecasters have data for:
There was a problem hiding this comment.
Choose a reason for hiding this comment
The reason will be displayed to describe this comment to others. Learn more.
Also now that I am adding hospitalizations which require even more data preprocessing (because of the difference in how the aheads work) this export function will probably need even more adjustments and require more decisions of what we actually want to show (the raw data vs the processed/filtered data that is shown in the plot). I can bring this up in our next meeting to get thoughts on what we want users to download.